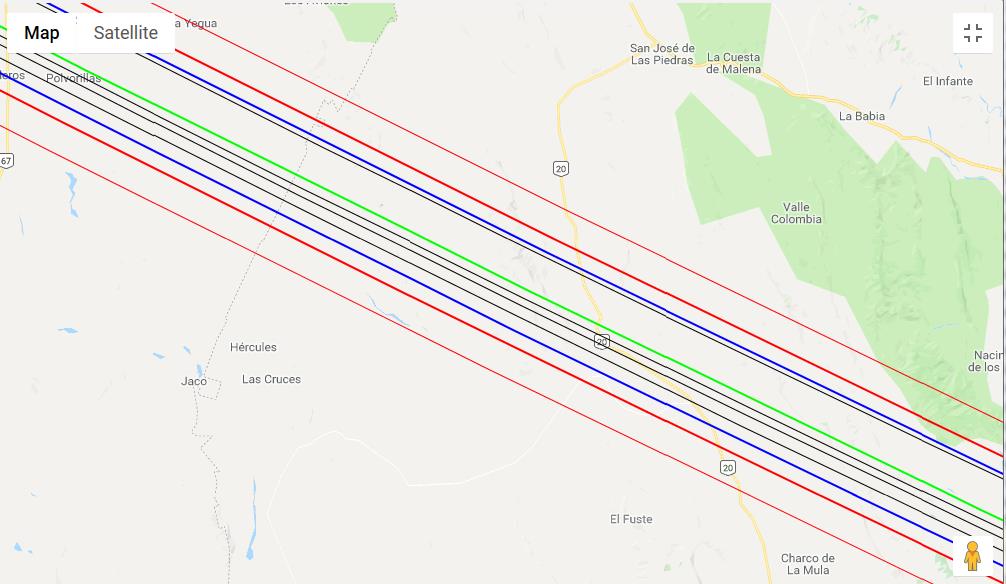
Maps below generated from Occult Watcher
green line - predicted central line
blue lines - blue lines - old limits; see discussion above using the shape model to generate better limits for this event
red lines - predicted 1-sigma & 2-sigma limits
Narrow gray lines - planned chords
------------------------------------------
Back to Eros page
Eross long axis is nearly perpendicular to both our line of sight, and to the direction of motion in the sky, so its projected path should be 46 km wide, rather than the 23 km width that Steve Preston gives in his prediction, assuming Eros to be spherical with diameter 16 km. You can use Derek Breits interactive Google map for the event at http://www.poyntsource.com/New/Google/20190312_62652.HTM to plot the new projected path, using offsets of -22.2 and +24.2 (-26.6 and +19.8 for the JPL prediction) for the dark gray lines to show the new limits; then ignore the old ones shown by the blue lines. The new path over the San Francisco Bay area is shown in the map below.
Keep in mind that the one-sigma error in Steve Prestons prediction is 4.1 km. And there could be a larger shift, if the spectral type B9 star is a close double. In addition, Jon Giorgini at JPL has computed (and posted on the Horizons Web site) an orbit that includes NEAR-Shoemaker ranging observations, some recent radar rangings, and the few past occultations that have been observed, relative to Gaia DR2 stars. Steve Preston has generated prediction files using the new JPL Horizons orbit. This JPL path is 4.4 km northeast of Steve Prestons prediction with a claimed 1-sigma path error of 1.7 km. Ive sent the files to Steve Messner, who can post the JPL prediction on the occultationpages.com page for this event, but we will keep Steve Prestons prediction so that Derek Breit doesnt have to change his Google map (link given above). The JPL prediction may be better than Steves, but we cant be sure of that; their 1-sigma uncertainties overlap. The Google map offsets are -26.6 and +19.8 for the dark gray lines to show the limits with the JPL prediction
David


Map below using JPL prediction offsets